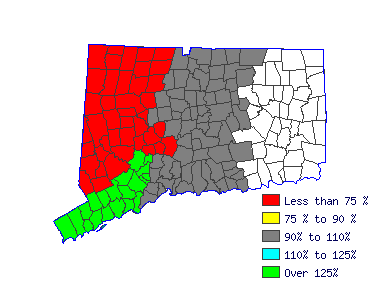
| North Central WDA (1Q 2016) |
| All Industry |
| Estimated employment | 420 |
| Mean wage | $40,868 |
| Entry wage | $27,306 |
| 10th percentile wage | $26,518 |
| 50th percentile wage | $37,465 |
| 90th percentile wage | $61,578 |
 | | Top Employing Industries |
| Industry | Employment / Percent |
| Education and Health Services | 420 | 100% |
 |
| Top Paying Industries |
| Industry | Employment / Median Wage |
| Education and Health Services | 420 | $37,465 |
 | |
 |
| Graduate Teaching Assistants (25-1191) |
| Assist department chairperson, faculty members, or other professional staff members in college or university by performing teaching or teaching-related duties, such as teaching lower level courses, developing teaching materials, preparing and giving examinations, and grading examinations or papers. Graduate assistants must be enrolled in a graduate school program. Graduate assistants who primarily perform non-teaching duties, such as laboratory research, should be reported in the occupational category related to the work performed. |
 |
| Mean Wage History |
| Year | This
Occupation | Compared to
Occupational Group | Difference |
| Current | $37465.22 | | $55535.36 |
| -$18070.14 | | 2015 | $36513.72 | +2.6% | $54124.94 |
+2.6% | -$17611.21 | | 2014 | $35829.83 | +1.9% | $53111.20 |
+1.9% | -$17281.36 | | 2013 | $35145.94 | +1.9% | $52097.46 |
+1.9% | -$16951.51 | | 2012 | $34462.06 | +2.0% | $51083.72 |
+2.0% | -$16621.66 | | 2011 | $33926.84 | +1.6% | $50290.35 |
+1.6% | -$16363.51 | | 2010 | $33332.15 | +1.8% | $49408.84 |
+1.8% | -$16076.68 | | 2009 | $32975.34 | +1.1% | $48879.93 |
+1.1% | -$15904.59 | | 2008 | $31994.11 | +3.1% | $47425.43 |
+3.1% | -$15431.32 | | 2007 | $30923.67 | +3.5% | $45838.71 |
+3.5% | -$14915.03 |
| Year | This
Occupation | Compared to
All Occupations | Difference |
| Current | $37465.22 | | $45452.32 |
| -$7987.10 | | 2015 | $36513.72 | +2.6% | $44180.67 |
+2.9% | -$7666.95 | | 2014 | $35829.83 | +1.9% | $43236.02 |
+2.2% | -$7406.18 | | 2013 | $35145.94 | +1.9% | $42364.03 |
+2.1% | -$7218.08 | | 2012 | $34462.06 | +2.0% | $41637.38 |
+1.7% | -$7175.32 | | 2011 | $33926.84 | +1.6% | $40983.39 |
+1.6% | -$7056.54 | | 2010 | $33332.15 | +1.8% | $40293.06 |
+1.7% | -$6960.91 | | 2009 | $32975.34 | +1.1% | $39748.07 |
+1.4% | -$6772.73 | | 2008 | $31994.11 | +3.1% | $38730.75 |
+2.6% | -$6736.64 | | 2007 | $30923.67 | +3.5% | $37495.44 |
+3.3% | -$6571.76 |
 |
|
| Reference Date: 1st Quarter 2016 |
| Top Areas For This Occupation |
|
|
|

| |


